Commercial and in Confidence
The information contained in this document is confidential. No part of this document may be reproduced, disclosed to any third party, or issued in any form or by any means without the express written permission of Intersoft Systems & Programming Ltd.
Contents
1. Document Controls
2. Table of Figures
3. Introduction
4. Booking Statistics
4.1. Today's Shipment Statistic
4.2. Time frame Shipment Statistics
5. Shipping Profiler
| Anchor |
|---|
| _Toc528933431 |
|---|
| _Toc528933431 |
|---|
|
Table of Figures
Figure 1 Booking Statistics Screen
Figure 2 Today's Shipment Statistic
Figure 3 Shipments per Country map
Figure 4 "Top Destinations", "Top Services", and "Top Agents" graph
Figure 5 Time Frame Shipment Statistics
Figure 6 Shipment Profiler
Figure 8 Late Shipments Graph
| Anchor |
|---|
| _Toc528933432 |
|---|
| _Toc528933432 |
|---|
|
| Anchor |
|---|
| _Toc473545162 |
|---|
| _Toc473545162 |
|---|
|
Introduction
Intelligent Shipper's Dashboard has two components:
- Booking statistics: Displays statistics for each shipment in different time frames.
- Shipping Profiler: Displays a profile of shipments to keep track of on time and late Shipments, and Shipment Weight by service.
This user guide is intended for Customer users only and describes each component of the Customer Dashboard. A different dashboard view is available for Administrator users
| Anchor |
|---|
| _Toc528933433 |
|---|
| _Toc528933433 |
|---|
|
| Anchor |
|---|
| _Toc476146439 |
|---|
| _Toc476146439 |
|---|
|
| Anchor |
|---|
| _Toc472607109 |
|---|
| _Toc472607109 |
|---|
|
| Anchor |
|---|
| _Toc472606204 |
|---|
| _Toc472606204 |
|---|
|
| Anchor |
|---|
| _Toc451157875 |
|---|
| _Toc451157875 |
|---|
|
| Anchor |
|---|
| _Toc448308014 |
|---|
| _Toc448308014 |
|---|
|
Booking Statistics
- Click on "Booking Statistics" on the left pane menu to access the Booking Statistics screen.
| Anchor |
|---|
| _Toc528933439 |
|---|
| _Toc528933439 |
|---|
|
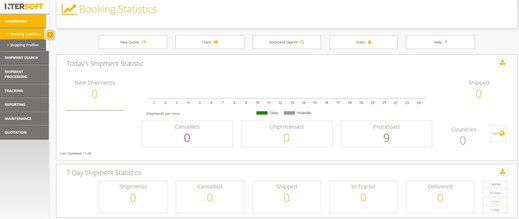
Figure 1 Booking Statistics Screen The Booking Statistics screen is divided into 2 sections:- Today's Shipment Statistic
- Shipment Statistics by Time Frame
| Anchor |
|---|
| _Toc528933434 |
|---|
| _Toc528933434 |
|---|
|
| Anchor |
|---|
| _Toc528933435 |
|---|
| _Toc528933435 |
|---|
|
Today's Shipment Statistic
| Anchor |
|---|
| _Toc528933440 |
|---|
| _Toc528933440 |
|---|
|
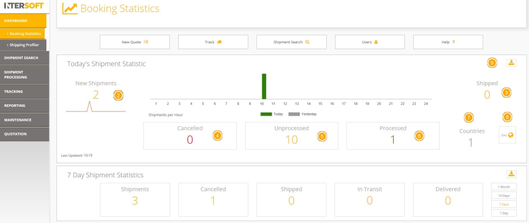
Figure 2 Today's Shipment Statistic 2. The number of New Shipments created today will be displayed on the screen, click on this number to see more information about these shipments in the "Total Shipments" Screen.- The number of Closed Out Shipments will be displayed under "Shipped".
- The number of Shipments that have been cancelled today will be displayed under "Cancelled".
- The total number of unprocessed Shipments in the system will be displayed under "Unprocessed".
- The total number of processed Shipments in the system will be displayed under "Processed".
- The number of destinations will be displayed under "Countries".
- Click on "Geo" button to open Shipments per Country map.
- Download the information displayed on screen
| Anchor |
|---|
| _Toc528933441 |
|---|
| _Toc528933441 |
|---|
|
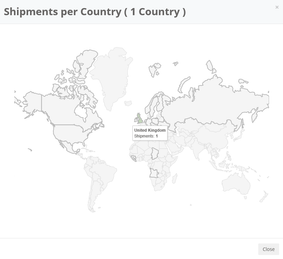
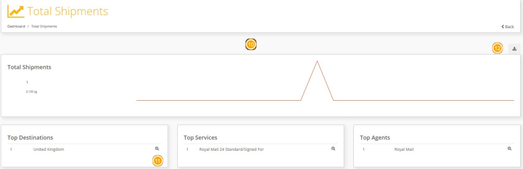
Figure 3 Shipments per Country map- By Clicking on "New Shipments" "Cancelled", "Unprocessed", "Shipped", "Processed" shipments or "Countries" a graph that will display the categories "Cancelled Destinations", "Top Destinations", "Top Services", and "Top Agents". For example, by clicking on "New Shipments" the Total Shipments Screen will display total number of shipments, top destinations, top services and top agents for New Shipments (Figure 4).
- Click on the magnifying glass to view additional information including the download icon.
- Download the information displayed on the screen via the icon
| Anchor |
|---|
| _Toc528933442 |
|---|
| _Toc528933442 |
|---|
|
Figure 4 "Top Destinations", "Top Services", and "Top Agents" graph| Anchor |
|---|
| _Toc528933436 |
|---|
| _Toc528933436 |
|---|
|
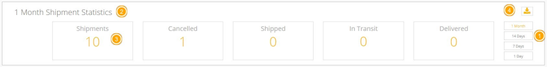
Time frame Shipment Statistics- The following time frames are available: 1 Month, 14 Days, 7 Days, 1 Day. Clicking on "1 Month", "14 Days", "7 Days", "1 Day" buttons will update the statistical date range displayed.
| Anchor |
|---|
| _Toc528933443 |
|---|
| _Toc528933443 |
|---|
|
Figure 5 Time Frame Shipment Statistics- For example, adjusting the Title "1 Month Shipment Statistics" will update the date range and visible statistics accordingly.
- The number of New Shipments will be displayed on the screen, click on this number to see more information about these shipments in the "Total Shipments" Screen which also provides the facility to download by a specific Country.
Note: Clicking on "Cancelled", "Unprocessed", "Shipped", "Processed" shipments and "Countries" will display similar graph and information for each category.
- Select the download icon in order to download the specific date range statistics.
| Anchor |
|---|
| _Toc528933437 |
|---|
| _Toc528933437 |
|---|
|
Shipping Profiler
- To open the Shipping Profiler, click on the "Shipping Profiler" Button. Once on the Shipping Profiler
| Anchor |
|---|
| _Toc528933444 |
|---|
| _Toc528933444 |
|---|
|
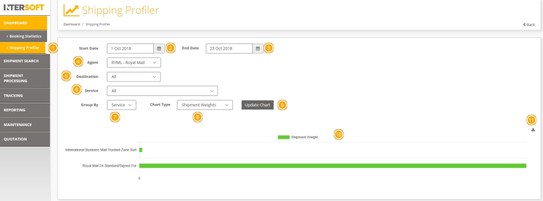
Figure 6 Shipment ProfilerEnter the information below to visualise the corresponding chart:- Start Date.
- End Date.
- Select an Agent (or All).
- Select a Destination (or All).
- Select a Service (or All).
- Group by Country, Service or Agent.
- Select Type of Chart Selection (Number of Shipments or Shipments Weights).
- The "Update Chart" button will refresh the Chart. Refreshing the chart will be required to show any new shipments that have taken place and the related available statistics.
- Figure 6 shows an example of a Shipments Weights Chart. Hovering on the Chart column will display the shipment weight as per figure 7
- The data that is displayed on the screen can be downloaded.
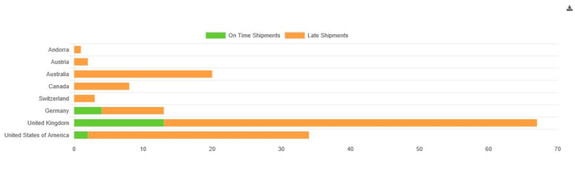
- For the "Number of Shipments" chart, click on "On Time Shipments" or "Late Shipments" header to remove the data from the chart. The Example in figure 8 below displays both "On Time Shipments" and "Late Shipments", however figure 9 displays the same graph with "On Time Shipments" removed. Hovering on the chart columns will further provide a statistical breakdown of the "On Time Shipments" and "Late Shipments".
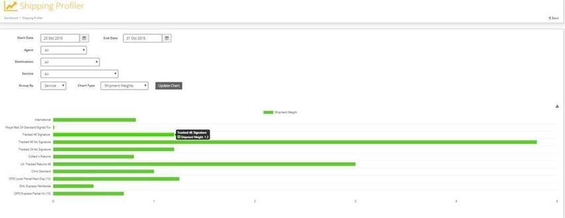
Figure 8 On Time Shipments and Late Shipments Graph
Figure 7 Shipments Weight Graph
| Anchor |
|---|
| _Toc528933445 |
|---|
| _Toc528933445 |
|---|
|
Figure 8 Late Shipments Graph 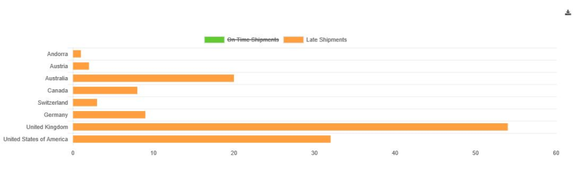 Figure 9 Late Shipments Graph